Proof of Play
Overview
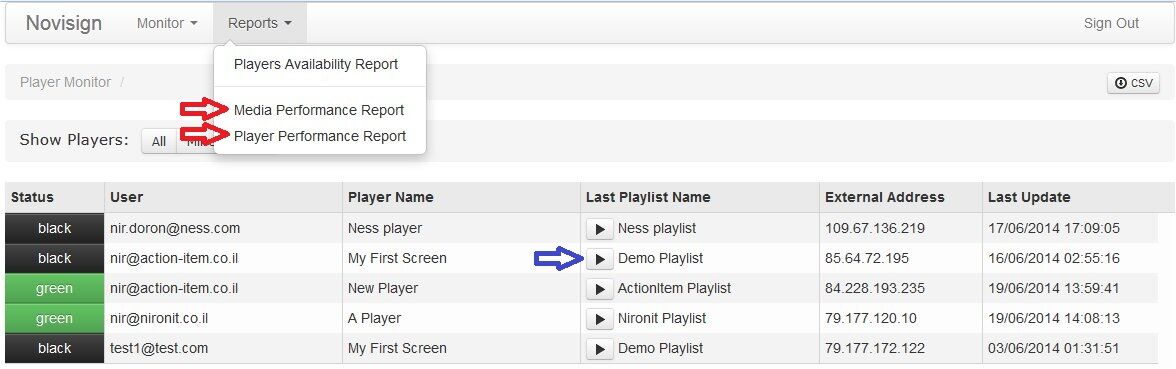
NoviSign has 2 types of performance reports for proof of play.
The 2 new reports come in addition to other reports: the screen/device monitor (which shows data from the last 24 hours), the availability report (which shows history of availability percentage) and the events report.
The reports are accessible through the regular link, either https://reports.novisign.com/.
What is proof of play? Imagine you have advertisers in your ad-network and you need to show them how many times that ad was broadcast or for how long was this ad being played, on how many stations and so on.
The reports will provide this data.
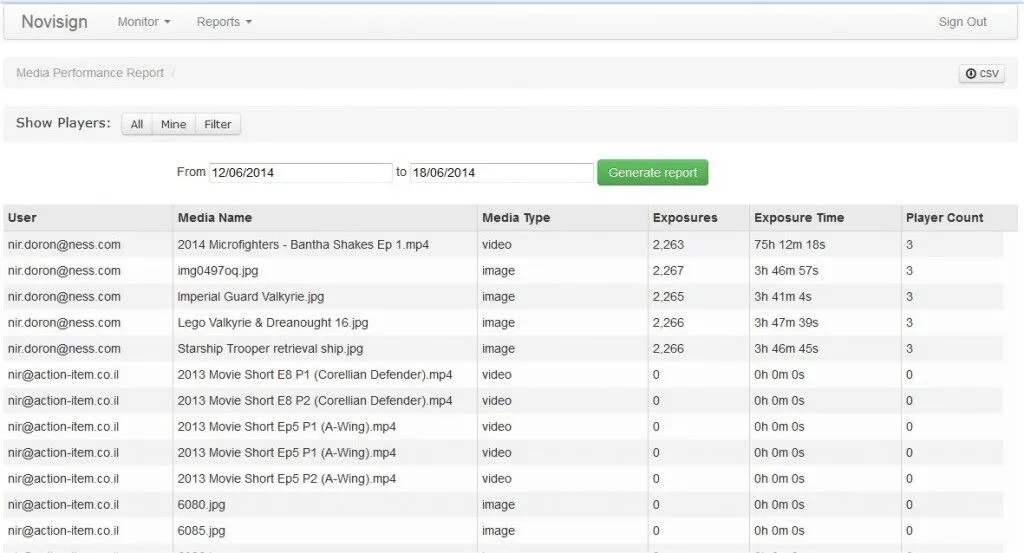
Media Performance Report
This report is the heart of “proof of play”.
It shows you the media name, type (video or image), number of exposures and total time of exposures in the filtered period (yesterday and beyond).
It also shows you in how many different screens was the creative played in that period.
A partner can filter by any of his/her users and/or by time range and/or by certain screens (players).
The report has 2 modes (you can choose by moving the radio button from “Aggregate by creative and media” to “Aggregate by media”.
The only difference between those 2 modes is that in the first one, you will also see a column named “Creative Name”, telling you under which creative is that media.
The report’s columns:
User – The user who owns the media (the media is in his/her account). If you’re a partner, you’ll see more than just your own username, but all of your users (you’ll be able to filter any of them). Regular user is not supposed to see this column.
Creative name – The name of the creative in which the media file is at (the creative itself is also countable, regardless the media). This column will appear only if you choose to aggregate the report by “creative and media”.
Media name – The name of the media file as it appears in you media library in your web editor account.
Media type – The type of the media. It can be either an image file or a video file.
Exposures – How many times was this media item being played during the filtered period in all the screens.
Exposure time – How long (in hours, minutes and seconds) was this media item being played during the filtered period in all the screens.
Player count – In how many screens was this media item being played during the filtered period.
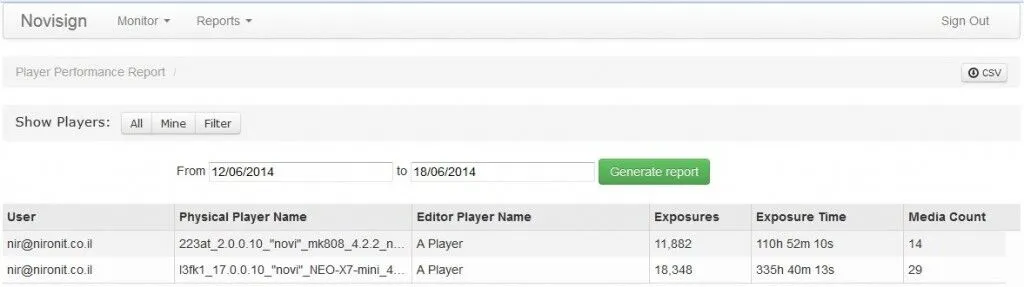
Devices Performance Report
This report is mainly used to show you a list of your physical devices with the screen (player) name as it is in the online Studio and also a total number of media exposures in that device, their total time and a media count to show you how many different media files (video or image) were played on that machine in the filtered period (yesterday and beyond).
A partner can filter by any of his/her users and/or by time range.
The report’s columns:
User – The user which his screen key runs directly on the machine (the screen key was created in his/her account). If you’re a partner, you’ll see more than just your own username, but all of your users (you’ll be able to filter any of them).
Device name – The name of the machine (if you access the application setting of the machine, then the first setting is the machine’s name. It is auto generated, but you can manually set it to any name you like).
Screen name – The screen (player) name (in the online Studio) related to the running screen key on that machine.
Exposures – How many times was any media item(s) being played during the filtered period on this machine.
Exposure time – How long (in hours, minutes and seconds) was any media item(s) being played during the filtered period on this machine.
Media count – How many different media items were played on this machine during the filtered period.
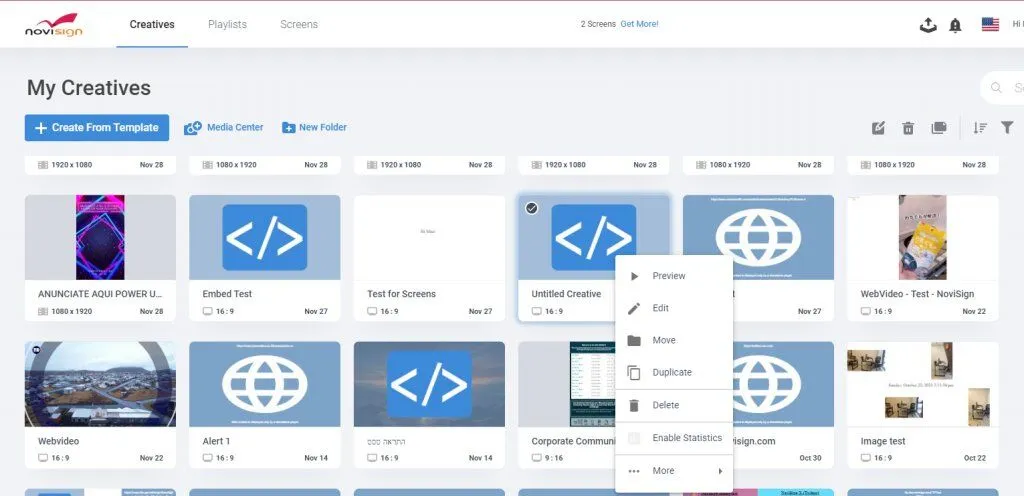
Please notice that for adding a creative to appear in the 2 new performance reports, you’ll have to do the following:
1. Enter your Studio account.
2. In the “Creatives” tab, for each creative, that you’d like to appear in the statistics, you’ll have to turn on the statistics icon which appears under the 3 dots of the creative. Clicking it will change the small icon color from black to blue.