The Monitoring & Reports tool (also known as the “Dashboard” or “Monitoring & Reports module” or just “Reports”) is a very important tool.
This is actually your “eyes” out there in your venues, which provides you of information of your media players, screens and devices in real time and for filtered periods.
To access the reports, just open a browser and go to https://reports.novisign.com
Use your Studio user to login into the reports. All the reports are presented in UTC time.
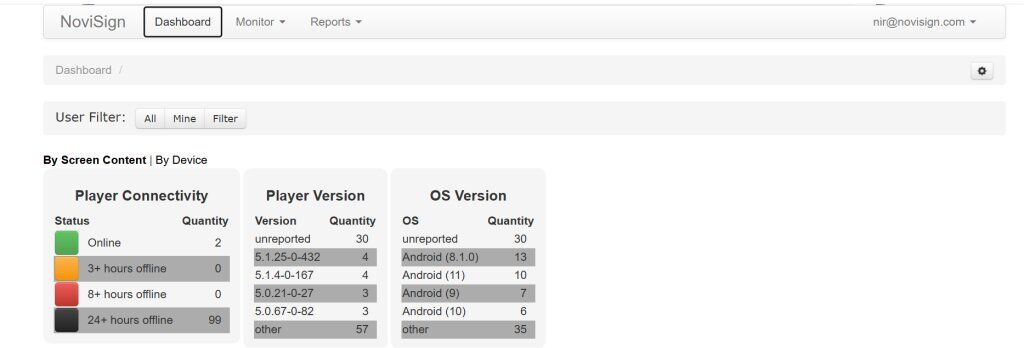
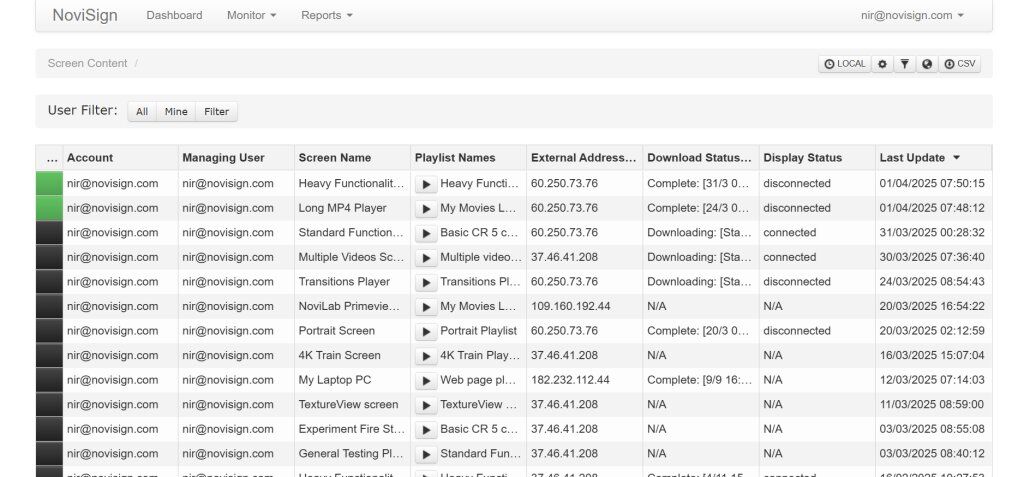
As a user you’d like to know which of your screens works well, which one may have issue (as well as no internet).
You might want to have some history reports of the screens’ availability and performance and maybe even some reports to show to your advertisers (if you have), such as the proof-of-play reports.
If you’re an end user, the tool will show you all the screens which are in accounts related to the user which you logged into to the reports.
If you’re a partner, you can login with your managing user and then be able to see not only the screen under the accounts related to this user, but all the screens in your subdomain of all your users.