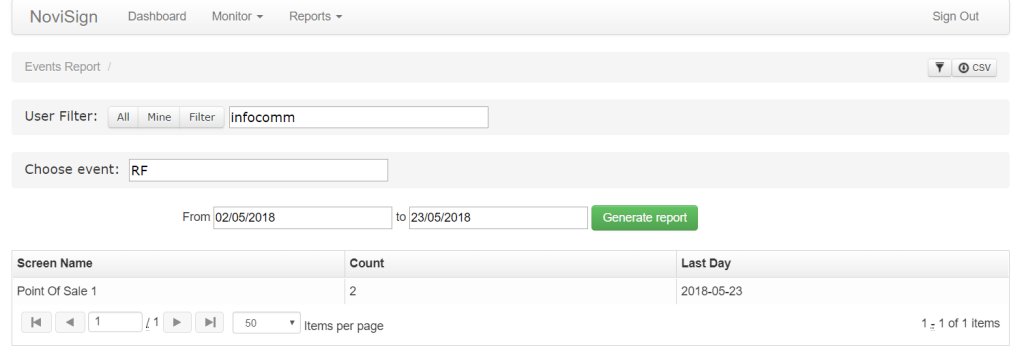
Recently, we have added a new report to your Monitoring & Reports tool. This report is called “Events Report”, The idea is to show you how many times a certain event took part in the date range you have set in the filter.
First, you have to choose an event: just start typing the event name in the “Choose event” textbox and it will be auto-completed. Then, set the start and end dates in the next 2 controls and press the “Generate report” button.
The report will appear and will have 3 columns:
“Screen Name” – The screen in which the event took part.
“Count” – How many times in the filtered date range, the chosen event took place.
“Last Day” – The last date in which the event was triggered on that screen.
This report can also be used for proof-of-play or for metrics to see how many times an event really happened. Example: how many times the door of the vending machine was opened (in this example, the vending machine door is connected to a sensor which is plugged by USB into the Android TV box which runs the signage app.
Dmitry.
